Hypothesis Testing
| x | no | yes |
|---|---|---|
| mean | 16610 | 17232 |
| sd | 5416 | 5739 |
| n | 250 | 250 |
1
Use this information to carry out a hypothesis test to address the retailer’s concern. Formulate null and alternative hypotheses in words and by referring to the relevant statistics, calculate the necessary (test) statistics, choose the correct critical value, apply the relevant comparison, and derive a conclusion.
Use a significance level of alpha=5%.
Info
- H0: refurbishing has no significant impact on price in population
- Ha: refurbishing has a significant impact on price in population
- z = (17232-16610)/sqrt(5416^2/250+5739^2/250)=622/499.1=1.24
- p-value ~ 0.85
- p is not large enough - no significant impact
2
Info
- x The test is not valid because it should have compared refurbished and not refurbished cars with otherwise similar (or identical) features.
- o The test is valid because it compares the prices of two groups distinguished by the only relevant criterion.
- x A necessary condition for this test to be valid is that other features of cars must not be related to the need for refurbishing.
- o This test design excludes the possibility of a sample-selection bias
Exploratory Factor Analysis
1
factanal(x = itsButter, factors = 2, scores = "Bartlett",
rotation = "none")

Loadings:

			   Factor1 Factor2
price          0.63    0.38
saturated fats 0.79   -0.04
vitamins       0.78   -0.21
storage life   0.69    0.31
calories 0.73 -0.21factanal(x = itsButter, factors = 2, scores = "Bartlett",
rotation = "varimax")
Loadings:
Factor1 Factor2
price 0.24 0.69
saturated fats 0.72 0.33
vitamins 0.73 0.34
storage life 0.34 0.68
calories 0.69 0.31Info
- o without rotation is better
- x with rotation is better
why? only positive values with rotation without rotation all variables load onto factor 1
2
Which variables load onto what factors? How would you interpret the factors?
Info
everything that is higher than 0.4 is loading factor 1: saturated fats, vitamins, calories factor 2: price, storage life
Labels: factor 1: nutritional value (more nutrients = more good) factor 2: customer value (not good if too high price or spoils too quickly)
3
What question can you answer with the R code eigen(corr.itsButter.sc)[1] where corr.itsButter.sc is the correlation matrix of the five variables “price”, ”saturated ats”, ”storage life”, ”vitamins”, ”calories”?
Info
this R code returns eigenvalues for each number that are higher than 1. Thus we see the number of factors
4
cortest.bartlett(corr.brand.sc,n=nrow(brand.ratings.itsNOTbutter))
$chisq
[1] 14.79785
$p.value
[1] 0.1396076
$df
[1] 10

KMO(brand.ratings.itsNOTbutter)
Kaiser-Meyer-Olkin factor adequacy
Call: KMO(r = brand.ratings.itsNOTbutter)
Overall MSA = 0.46
MSA for each item =
price saturated fats vitamins storage life calories
0.46  0.47           0.26     0.66         0.45
Info
that would NOT make sense bartlett’s test: the p value is higher than 0.05 (actual 0.139) KMO: MSA is lower than 0.5 (actual 0.46)
5
Imagine, you are dealing with a data set that contains a lot of highly correlated variables. If your overall goal is to reduce the variables into a smaller subset of uncorrelated variables which method should you ideally choose in order to accomplish the task?
Info
- o Common Factor Analysis
- x Principal Component Analysis
Regression
1
Visualization: First, you look at the following two graphs to explore revenue’s distribution (left graph, red line: mean(revenue)) and development over time (right graph, blue line: revenue ~ time, with 95% error margins). Describe what you see. What does this mean for the management?
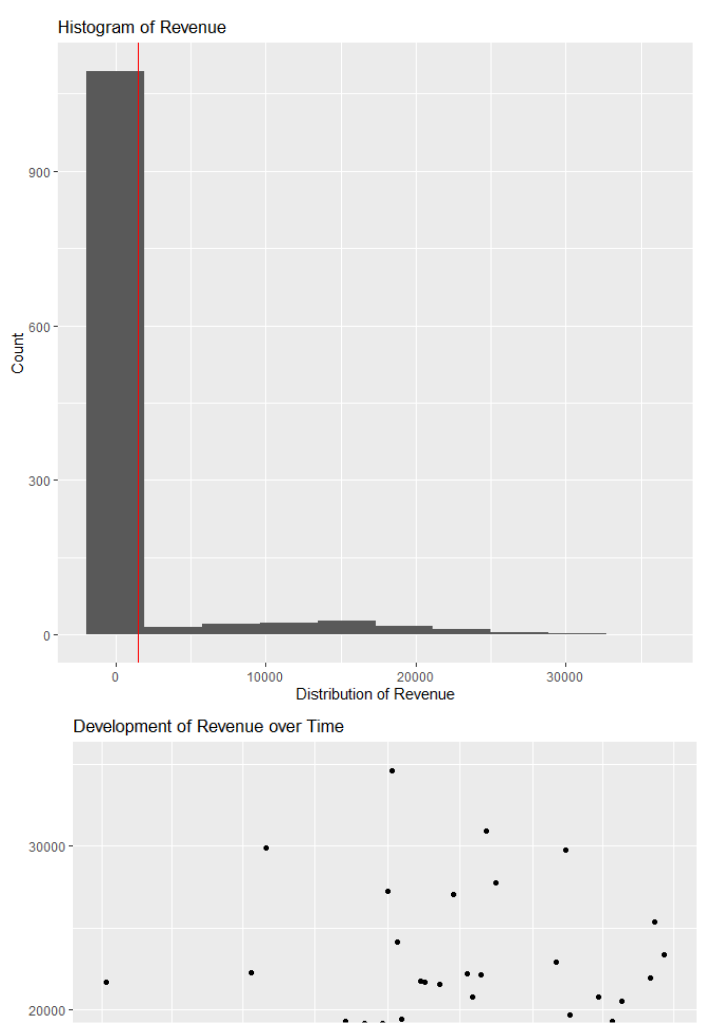
lower chart is cut off
Info
- histogram. Most of the revenues mean is higher than o but lower than 5000 ( i would assume around 2000) with the high count. but the increase of revenue indicates the decrease of count.
- Revenue is not equally distributed!
- the second graph (right) shows the increase of revenue each month. we can see that the revenue slighltly increases each month. However the points are located everywhere in throughout the graph which cannot indicate high model explanation. But the idea is increasing revenues each month.
- implication: regression model will focus solely on the baseline between 0 and 5000 and have a low accuracy on the higher values and increases
2
Regression: To find out, what makes a banner ad more successful in terms of revenue, you are running the following regression model. You include clicks, ad price (cost per mile), number of display ads on the website (including yours), the ads view rate, as well as a dummy variable indicating if the ad was displayed in a contextually fitting website environment (i.e., dummy is 1 if website was sports or health related, 0 otherwise, note: non-contextual the baseline). Please note down the regression equation. Interpret the model. What does the output tell you about your model’s usefulness?
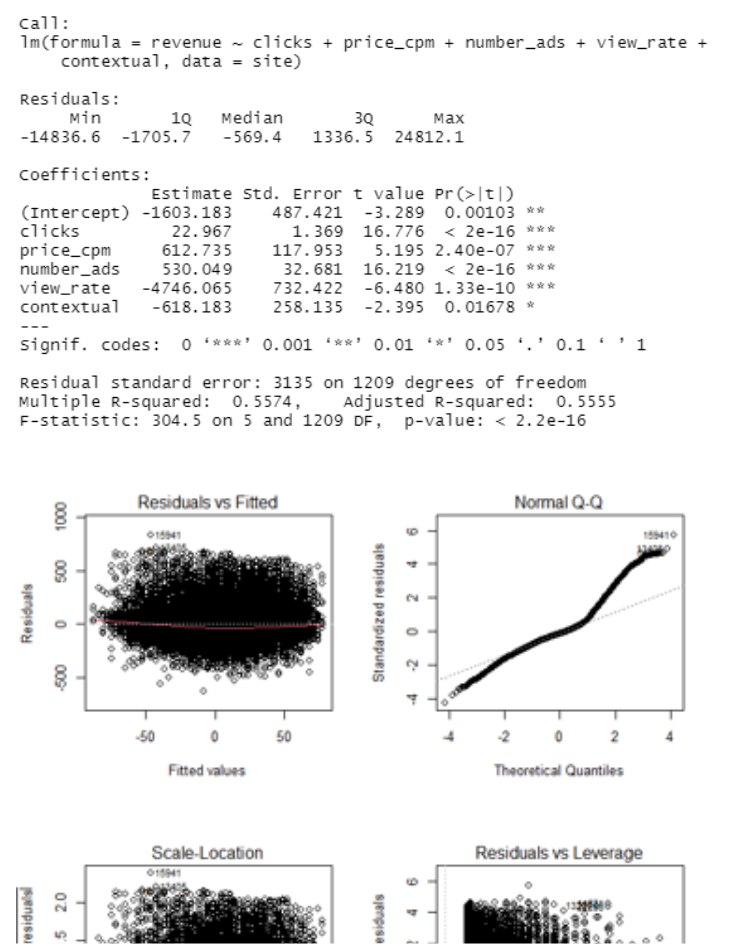
lower charts are cut off
Info
y … revenue y = -1603.183 + 22.967x1+ 612.735x2+ 530.049x3- 4746.065x4 - 618.183x5 the intercept is -1603.183 there are 5 dummies and each dummy can be increased by units, with the increase of clicks by 1, the revenue increase by 22.967. with the increase of price cost per mile, the revenue increses by 612.735. with the increase of number of ads by 1, the revenue increase by 530.049 with the increase of view rate by 1 the revenue decreases by 4746.065 with the increase of contextual by 1 the revenue decreases by 618.183 overall the model is alright, the worst variable
contextualis still significant with p<0.05. 55.74% of the data can be described by the model. However i think the problem of the model is that view rate decreases the revenue which should be otherwise. the same goes with contextually fitting ads
3
Implications: Based on these results, what are your suggestions or considerations about your model? What would you advise your marketing manager to do or change about their banner ad strategy given your output? (2 points)
Info
suggestion: buy more expensive ads since the price cost per mile has the strongest positive correlation. Also increasing the number of ads has a high correlation so more ads = more good
4 - Simulation
1
Describe two situations, in which simulation should not be applied to solve a business problem.
Info
- Simulation should not be applied when the cost of running the simulation are higher than potential benefit that would be gained
- Also the simulation should not be used when execution is not technically feasible
2
The two following R codes do similar, but in essence different things. Explain what they do in the context of simulation and the main difference there is between them.
a) sample(c(10:30),1)
b) 10 + 20*runif(1,0,1)
Info
a)
sample(c(10:30),1)creates one random number from a discrete uniform distribution, i.e. integer values from 10 to 30 with equal probability b)10 + 20*runif(1,0,1)runif(1,0,1)creates one random number from a continuous uniform distribution between 0 and 1. By multiplying it with 20 and adding 10, the resulting random number is also in the range of 10 to 30, but not limited to integers any more.
3
Info
- o Using inverse transformation sampling, it is possible to turn uniformly distributed random numbers into random numbers from any other probability distribution.
- x The normal distribution is quite tricky to simulate demand data because it can take on any continuous values from minus infinity to infinity.
- x The sampling distribution can be created by repeatedly taking samples from a population, calculating the mean of each sample and then taking the mean of those means.
- x In order to reduce the length of the confidence interval in a simulation, more simulation runs need to be carried out (ceteris paribus).
- x Given a large number of simulation repetitions, the sampling distribution is roughly normally distributed with a mean of and standard deviation of
Linear Programming
The Garden Shop mixes two types of grass seed into a blend and sells it in packages of 300 pounds. Each type of grass seed has been rated (per pound) according to its shade tolerance and its ability to stand up to traffic, as shown in the table. Type A seed costs 2. The blend needs to score at least 320 points for shade tolerance and 400 points for traffic resistance. Develop an LP model that can be used to determine
1
How many pounds of each seed should be in one package of the blend in order to minimize costs while satisfying all the constraints. Do not forget to define the decision variables. You do not need to solve the model.
									  Type A Type B
Shade Tolerance (points per pound)    1      2
Traffic Resistance (points per pound) 2      1
Info
- seed costs
- minimum:
- constraints:
- Non-negativety
2
mark NOT TRUE regarding linear programming
Info
- o An optimal solution always satisfies all constraints.
- x An infeasible solution always violates all constraints.
- o A feasible solution point does not have to lie on the boundary of the feasible region.
- o A feasible solution always satisfies all constraints.
3
All linear programming problems have all of the following properties EXCEPT
Info
- o a linear objective function that is to be maximized or minimized.
- o a set of linear constraints.
- x alternative optimal solutions.
- o variables that are all restricted to nonnegative values.
4
Which of the following is not true regarding the linear programming formulation of a transportation problem?
Info
- o The number of variables is (number of origins) x (number of destinations).
- x The number of constraints is (number of origins) x (number of destinations).
- o The constraints’ left-hand side coefficients are either 0 or 1.
- o Costs appear only in the objective function
5
Let x, y and z be decision variables. Which of the following is a valid objective function for a linear programming problem?
Info
- x
- o
- o
- o